


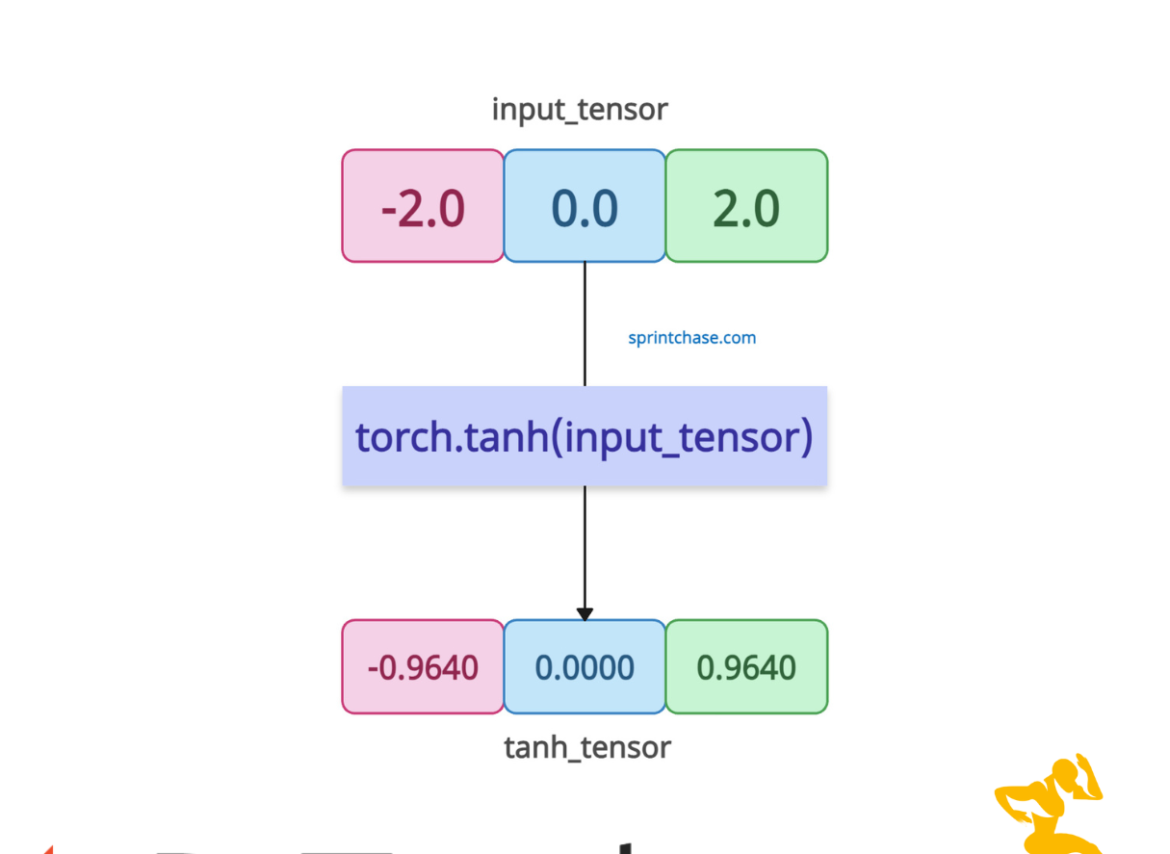
The torch.tanh() method calculates the hyperbolic tangent of each element in the input tensor. It smoothly maps any real number input to a value between -1 and 1. Unlike sigmoid, the output values are centered around zero.
You can use it in neural networks to introduce non-linearity, mapping input values to the range (-1, 1), particularly in architectures like LSTMs and GRUs, where bounded activations are beneficial.
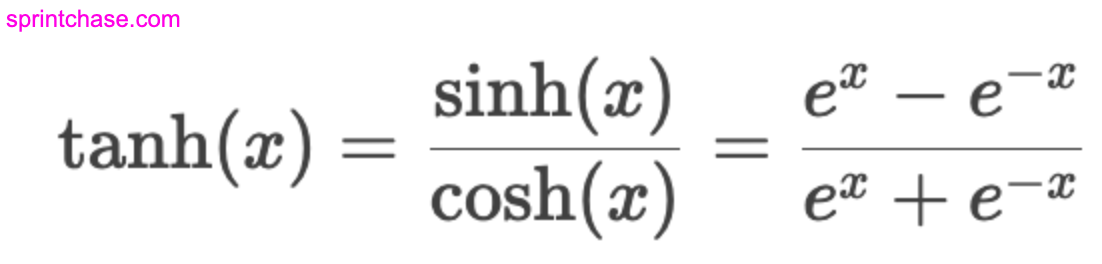
It squashes input values into the range [-1, 1] using the formula:
Syntax
torch.tanh(input, out=None)
Parameters
| Argument | Description |
| input (Tensor) |
It represents an input tensor of any shape. The elements in the tensor can be real numbers (such as float, double, etc.). |
| out (Tensor, optional) |
It represents an output tensor to store results. If None, the new tensor is created. |
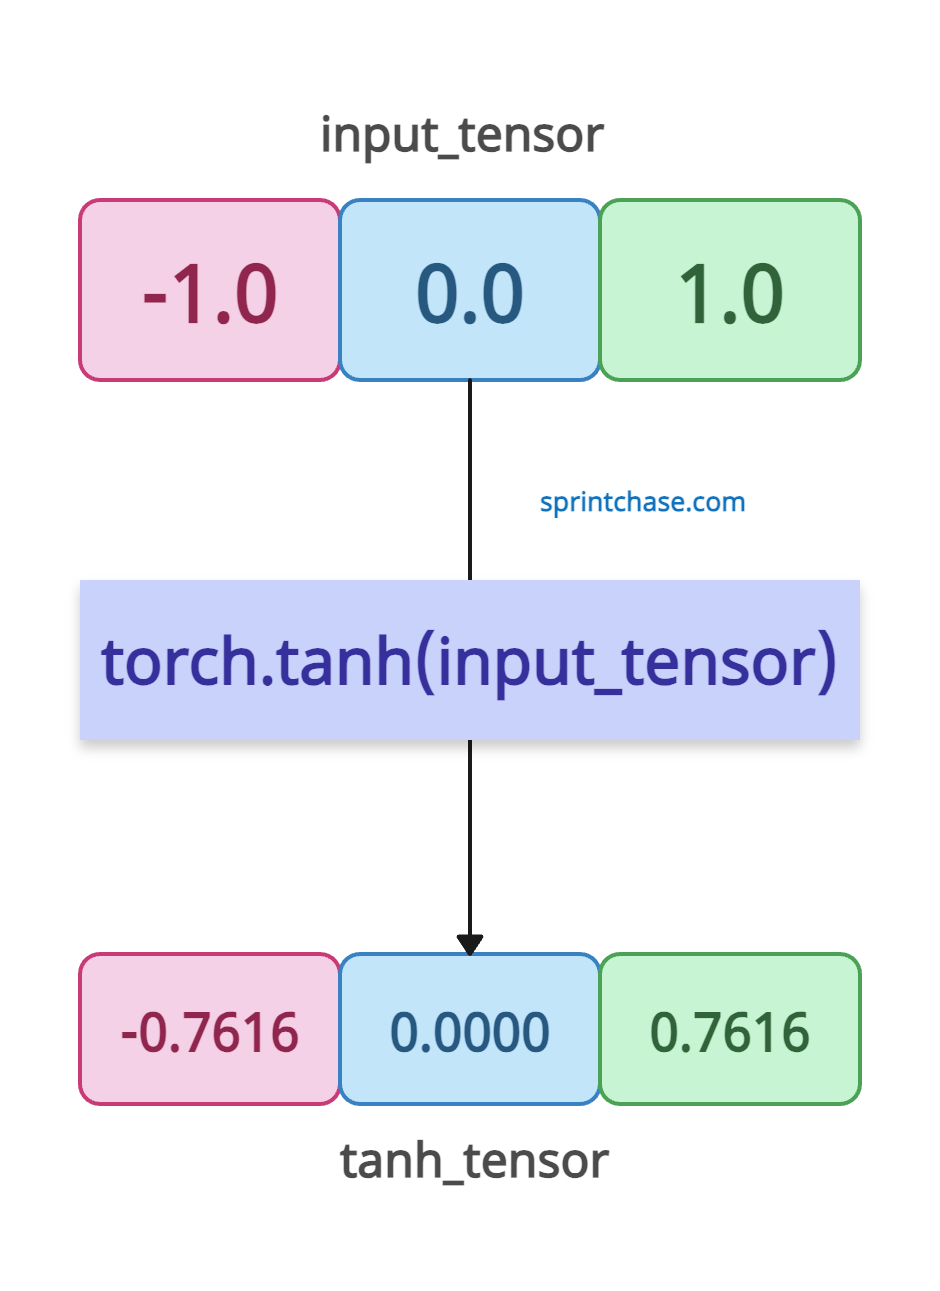
Basic usage with a 1D Tensor
If your input 1D tensor contains 3 elements, the output tensor will also have 3 elements.
import torch

input_tensor = torch.tensor([-1.0, 0.0, 1.0])

tanh_tensor = torch.tanh(input_tensor)

print(tanh_tensor)

# Output: tensor([-0.7616,  0.0000,  0.7616])
2D Tensor
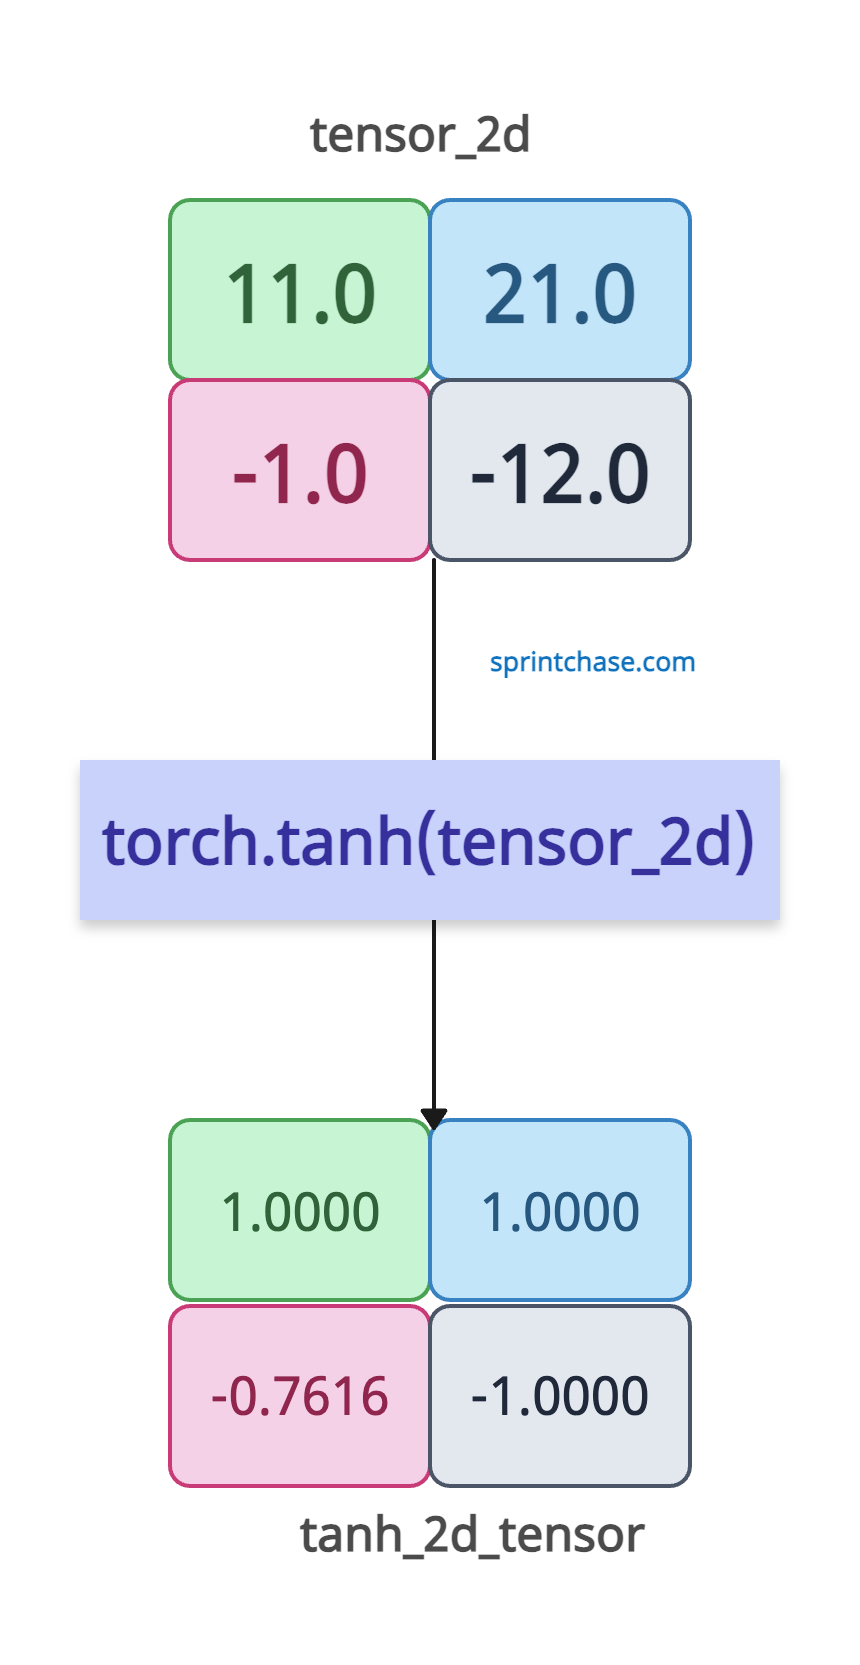 If the input tensor is two-dimensional, the output tensor is also two-dimensional.
import torch

tensor_2d = torch.tensor([[11.0, 21.0], [-1.0, -12.0]])

tanh_2d_tensor = torch.tanh(tensor_2d)

print(tanh_2d_tensor)

# Output:
# tensor([[ 1.0000,  1.0000],
#         [-0.7616, -1.0000]])
In-place modification with torch.tanh_()
If you don’t want to create a new tensor, you can modify the existing input tensor by using the .tanh_() method.
import torch

tensor_1d = torch.tensor([1.5, -1.5])

# Applying tanh in-place
tensor_1d.tanh_()

print(tensor_1d)

# Output: tensor([ 0.9051, -0.9051])
It will help us reduce memory overhead, but you have to be cautious because it overwrites the original data.
Visualization
We can visualize the values of the tanh activation function using the matplotlib library.import torch
import matplotlib.pyplot as plt
input_tensor = torch.linspace(-5, 5, 100)
output_tensor = torch.tanh(input_tensor)
plt.plot(input_tensor, output_tensor)
plt.title("tanh Activation")
plt.xlabel("Input")
plt.ylabel("Output")
plt.grid(True)
plt.show()
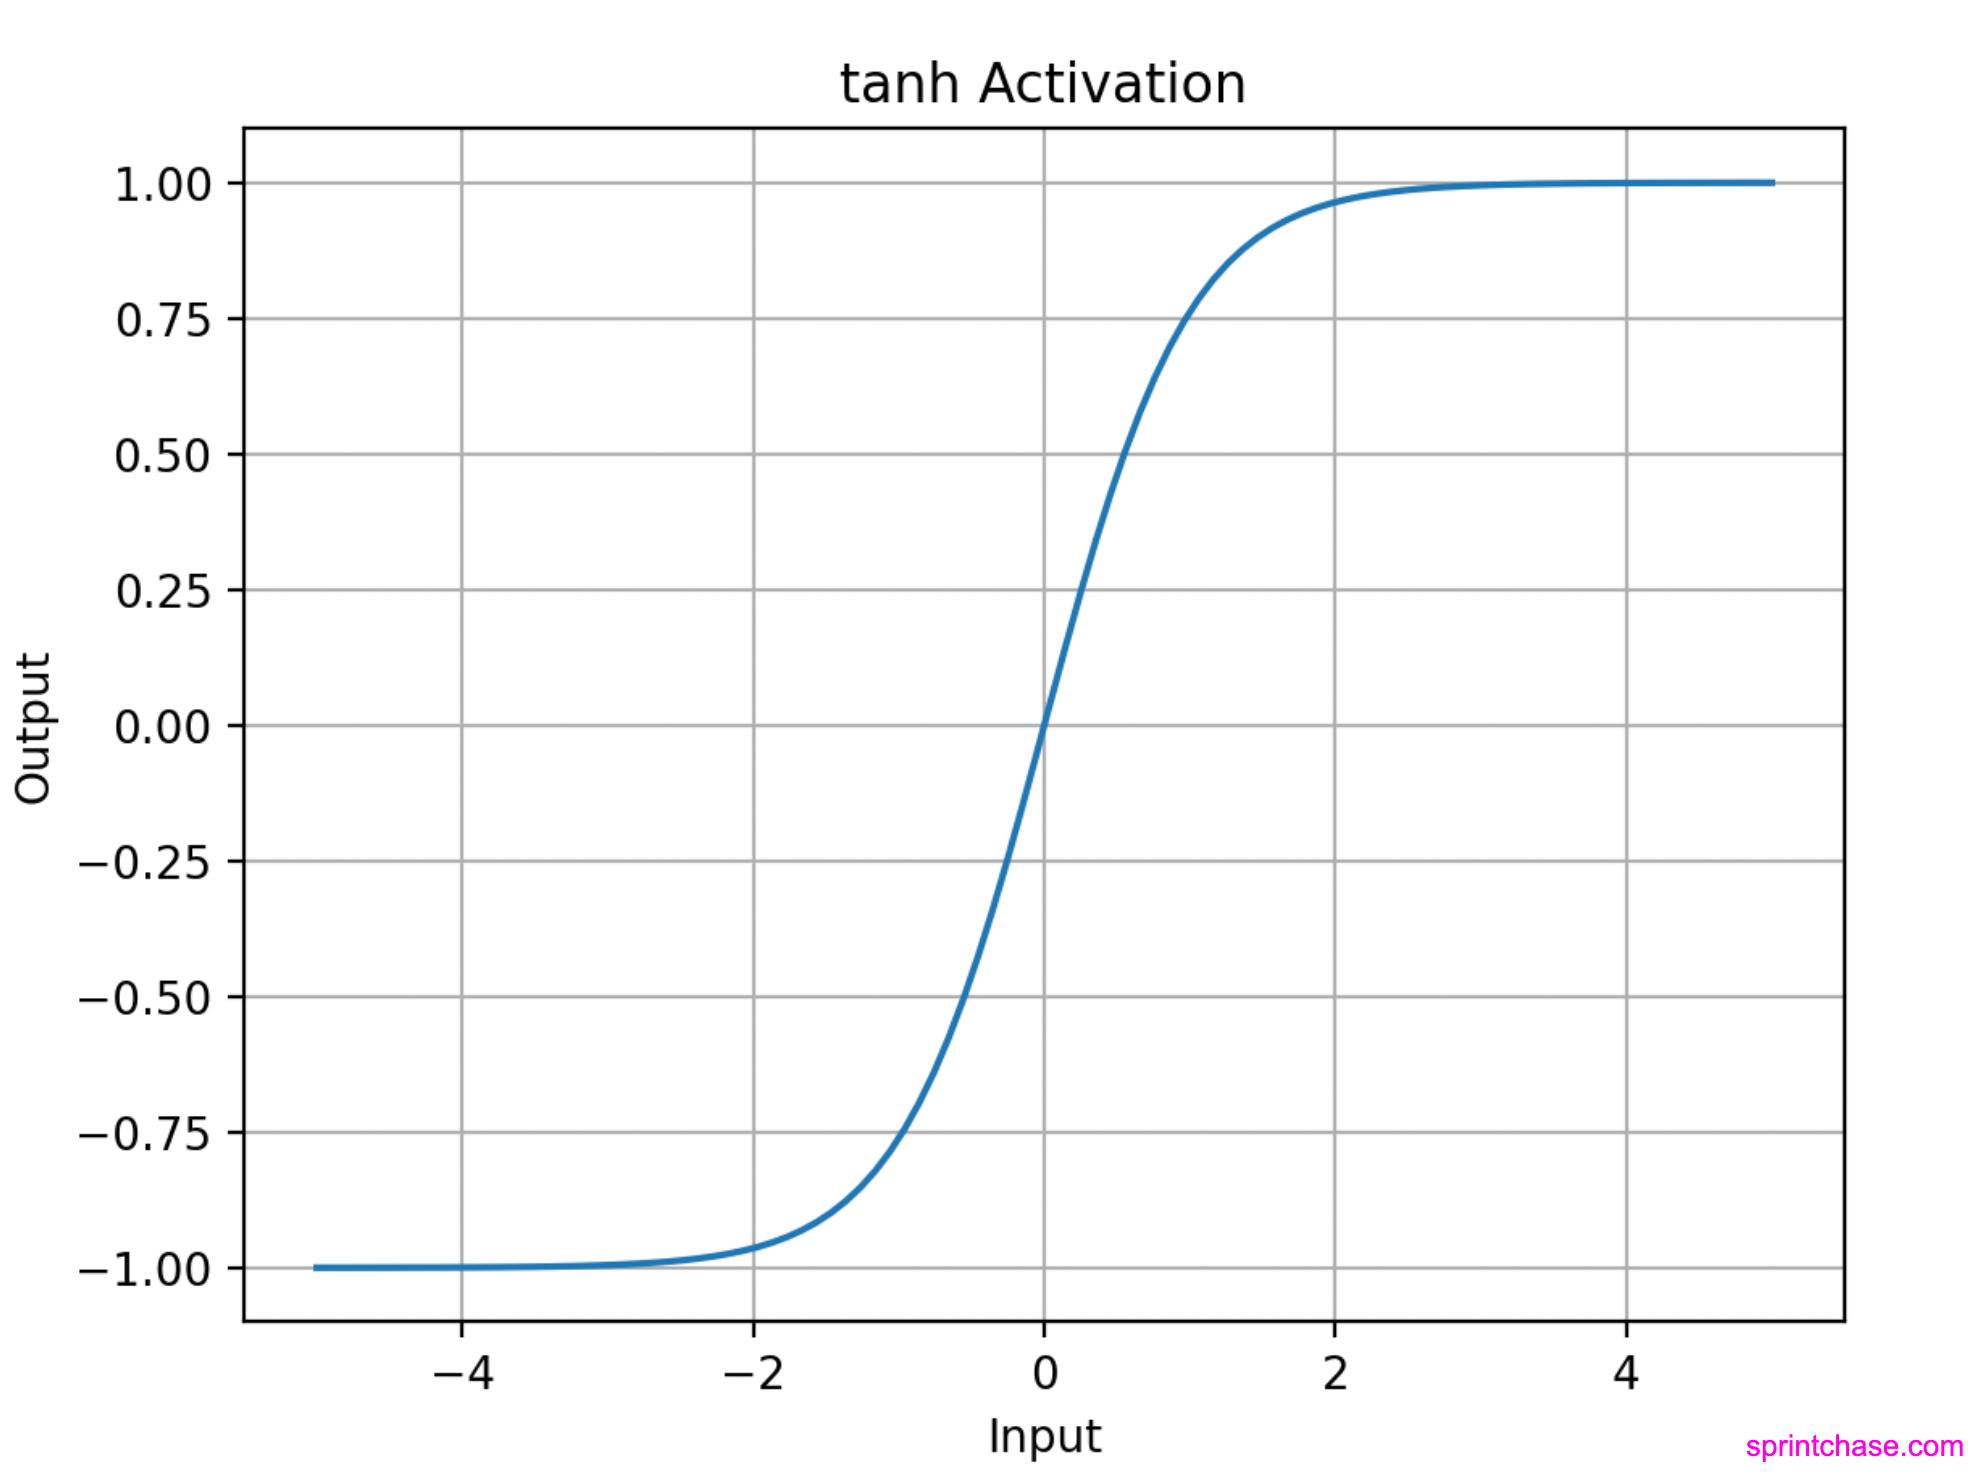 You can see from the above plot that tanh values are in an S-shaped (sigmoid-like, but centered at 0).
That’s all!
You can see from the above plot that tanh values are in an S-shaped (sigmoid-like, but centered at 0).
That’s all! 